Grafana with Portworx
This document presents the non-Kubernetes method of monitoring your Portworx cluster with Grafana. Please refer to the Prometheus and Grafana page if you are running Portworx on Kubernetes.
Prerequisites
- Some of the panels in the Portworx dashboards require Node Exporter running on Portworx nodes. Without Node Exporter, these panels might show ‘No data’.
- The Prometheus AlertManager plugin must be installed on Grafana, and the AlertManager endpoint must be added as a data source.
Configure Grafana
Start Grafana with the following docker run command
docker run --restart=always --name grafana -d -p 3000:3000 grafana/grafanaLog in to Grafana at
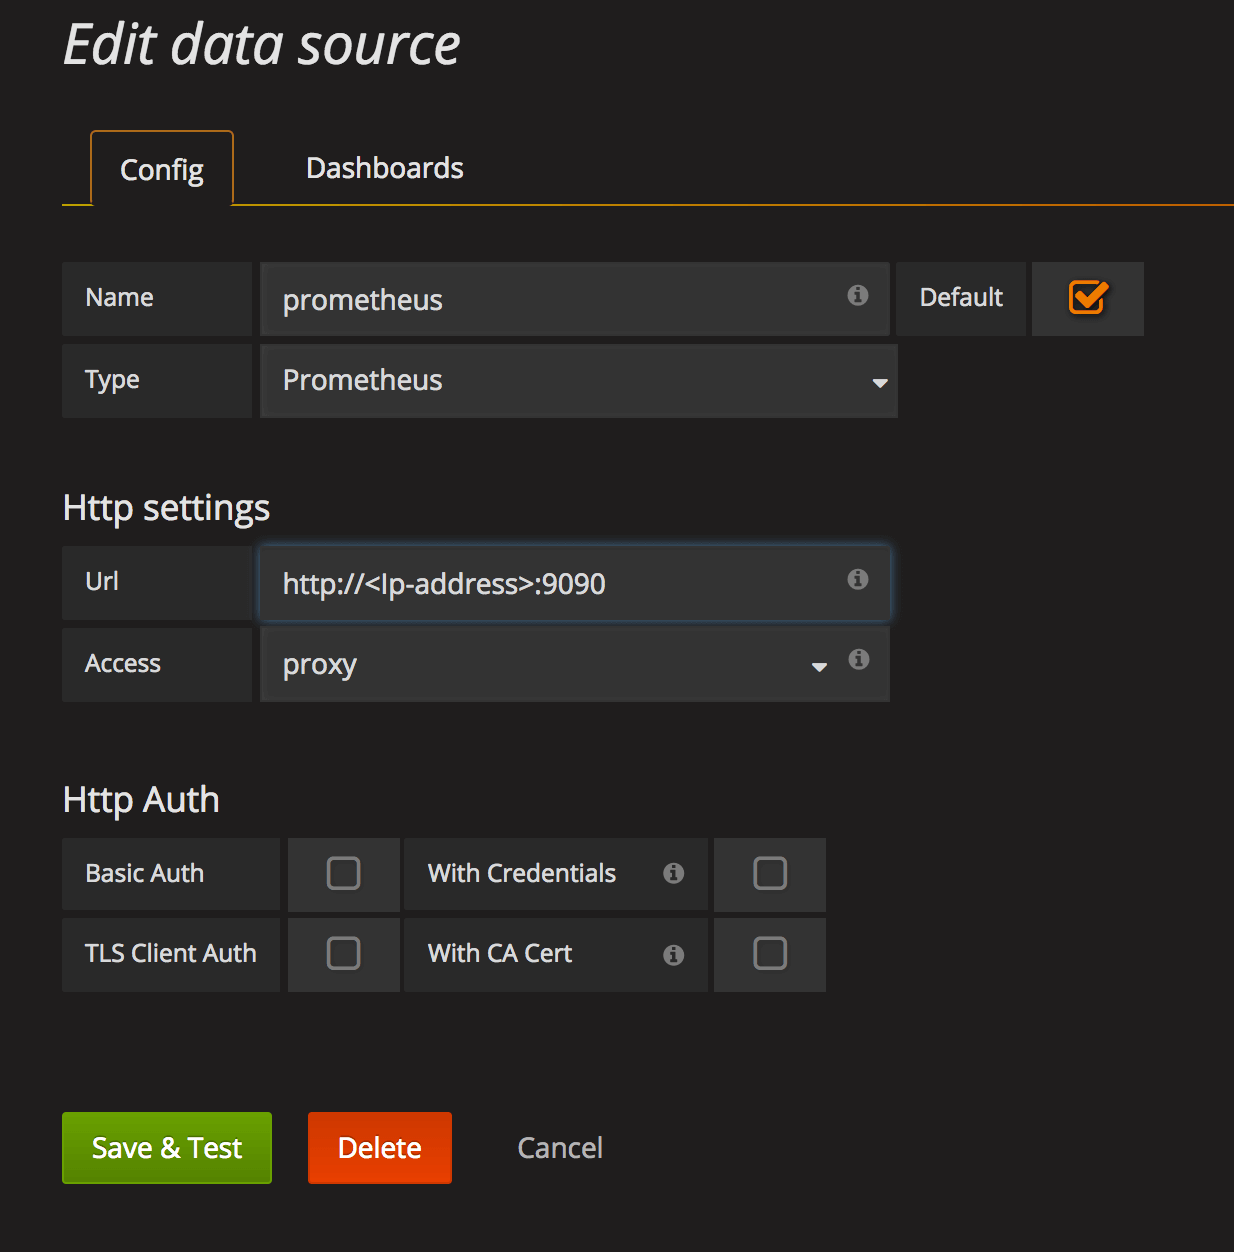
http://your_ip_address:3000in your browser. The default Grafana login isadmin/admin.Once logged in, Grafana will ask you to configure your datastore. Use the Prometheus that you configured earlier. To use the templates that are provided later, name your datastore 'prometheus'. In the screen below:
Choose 'Prometheus' from the 'Type' dropdown.
Name datastore 'prometheus'
Add URL of your prometheus UI under Http settings -> Url
Select Save & Test
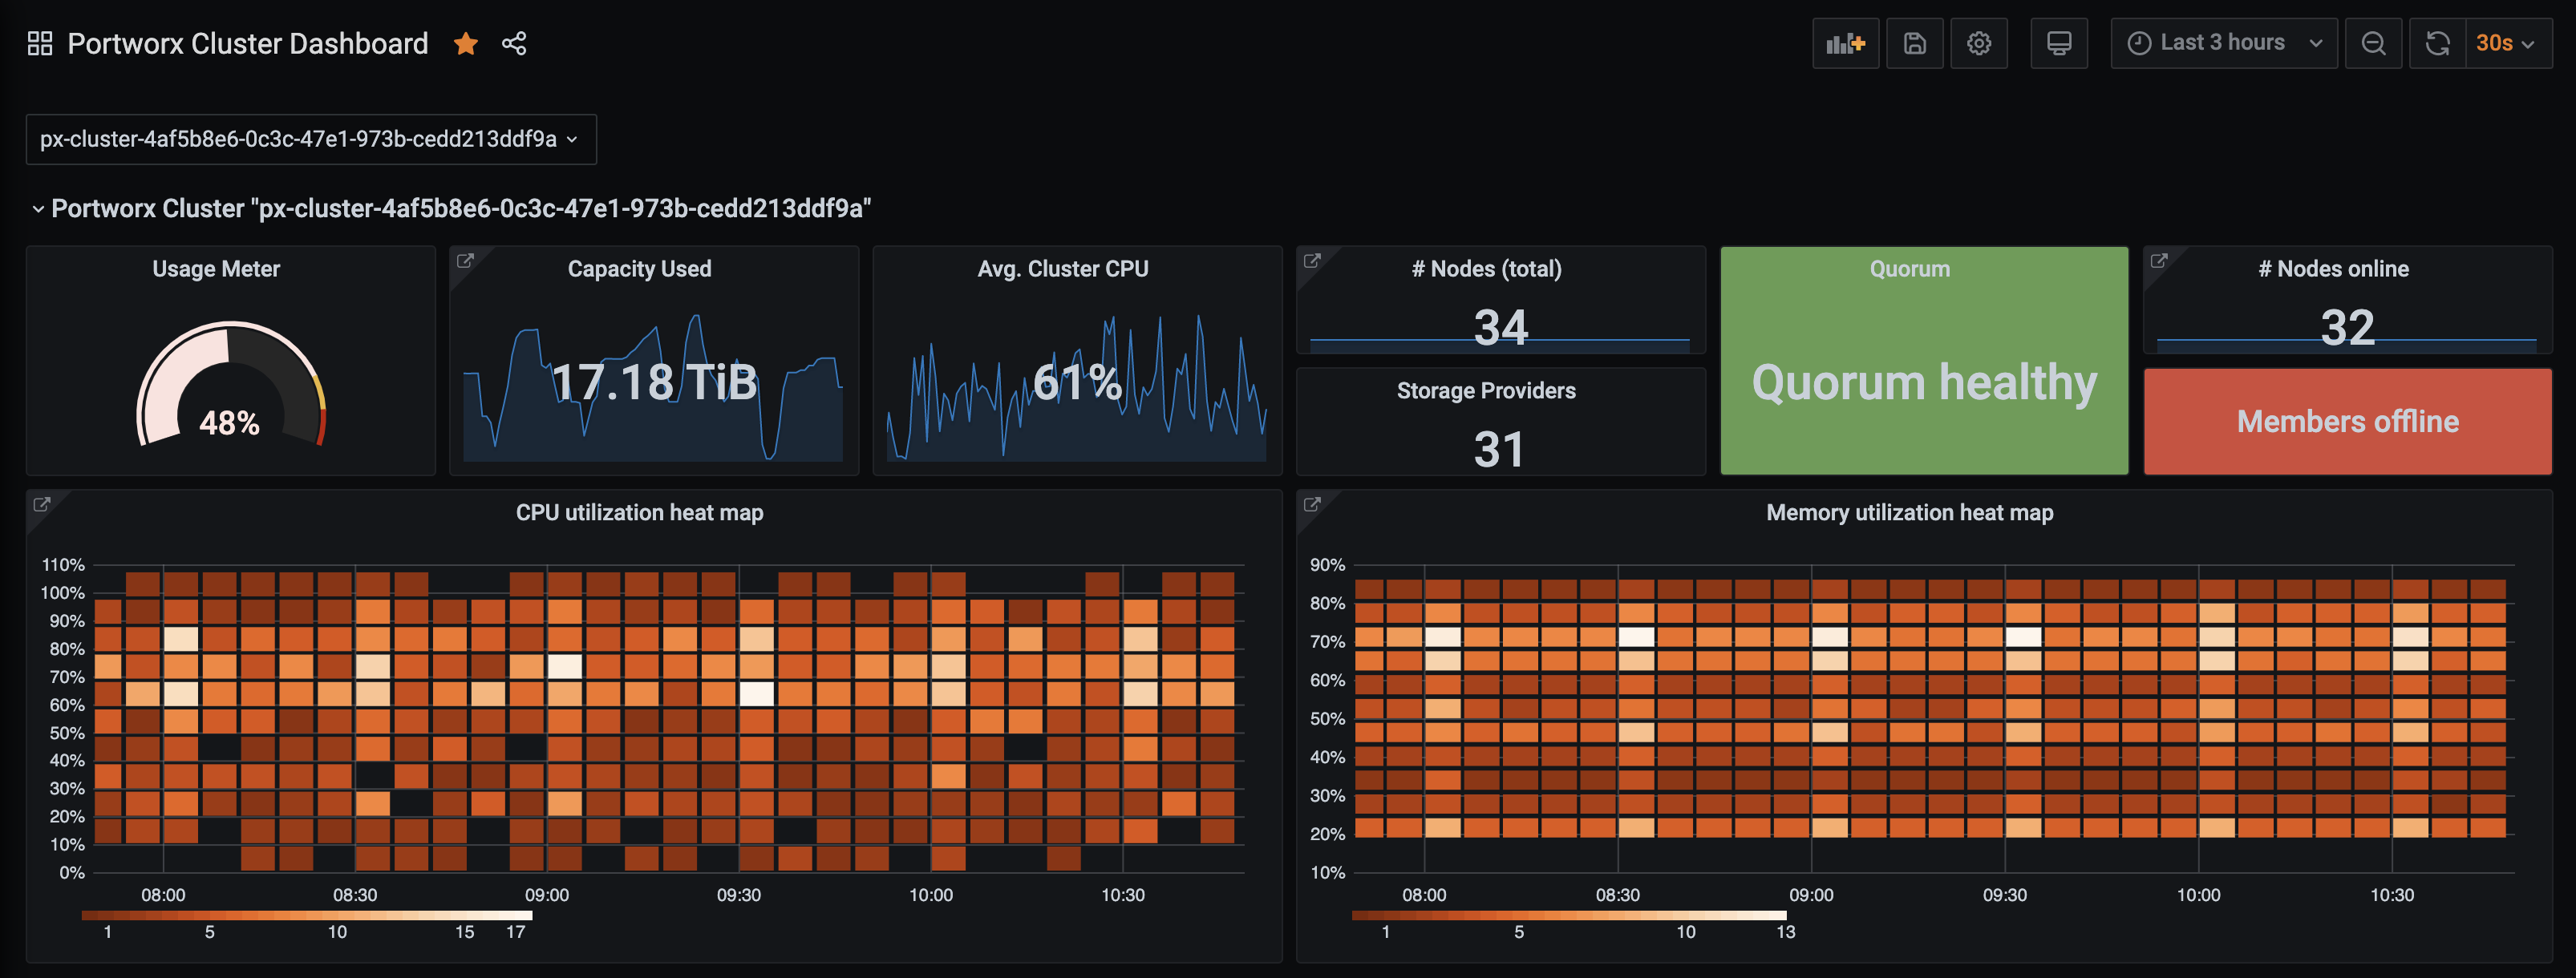
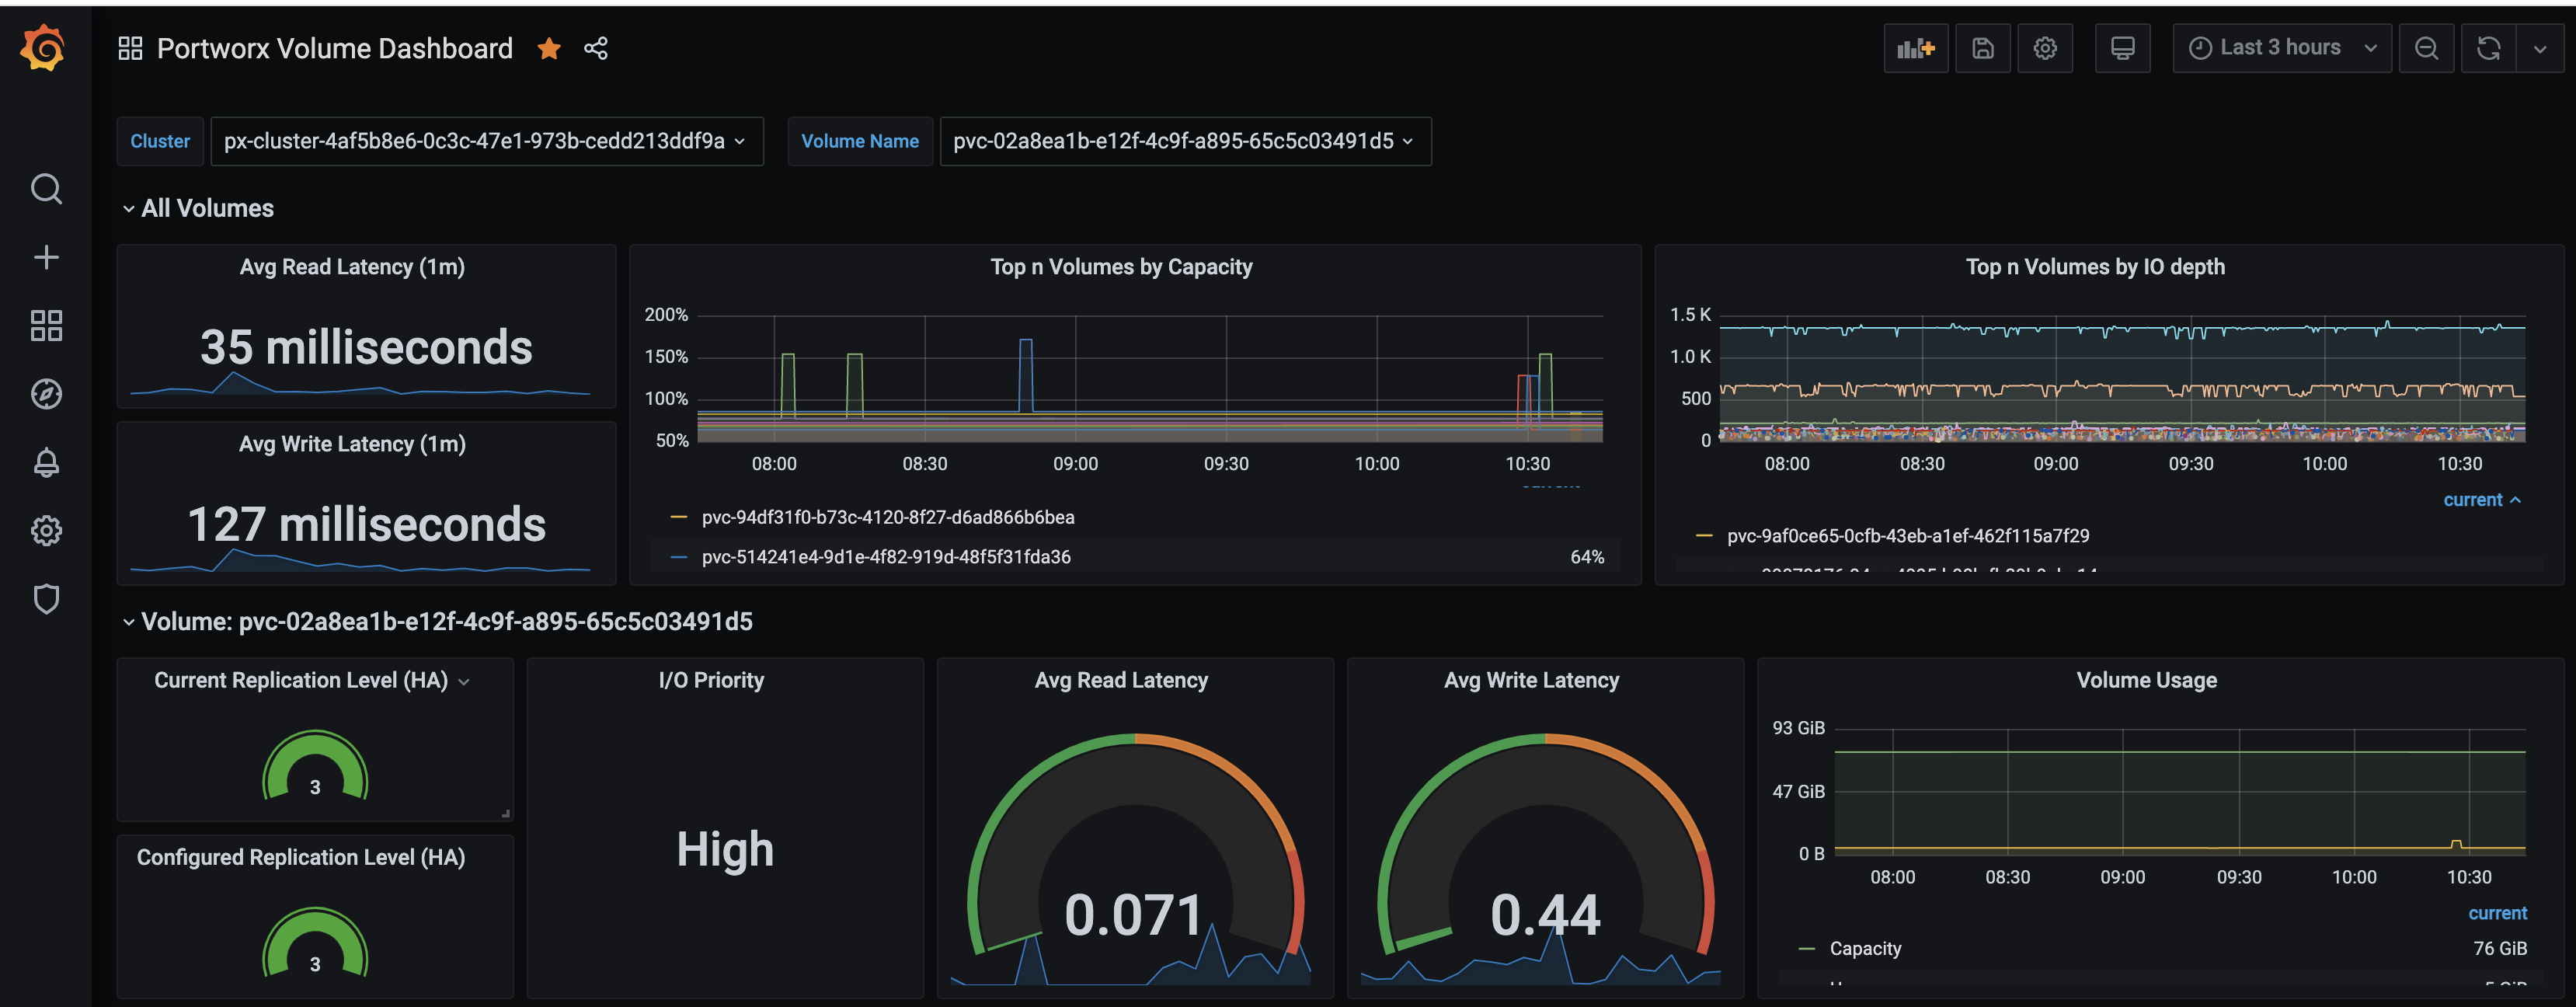
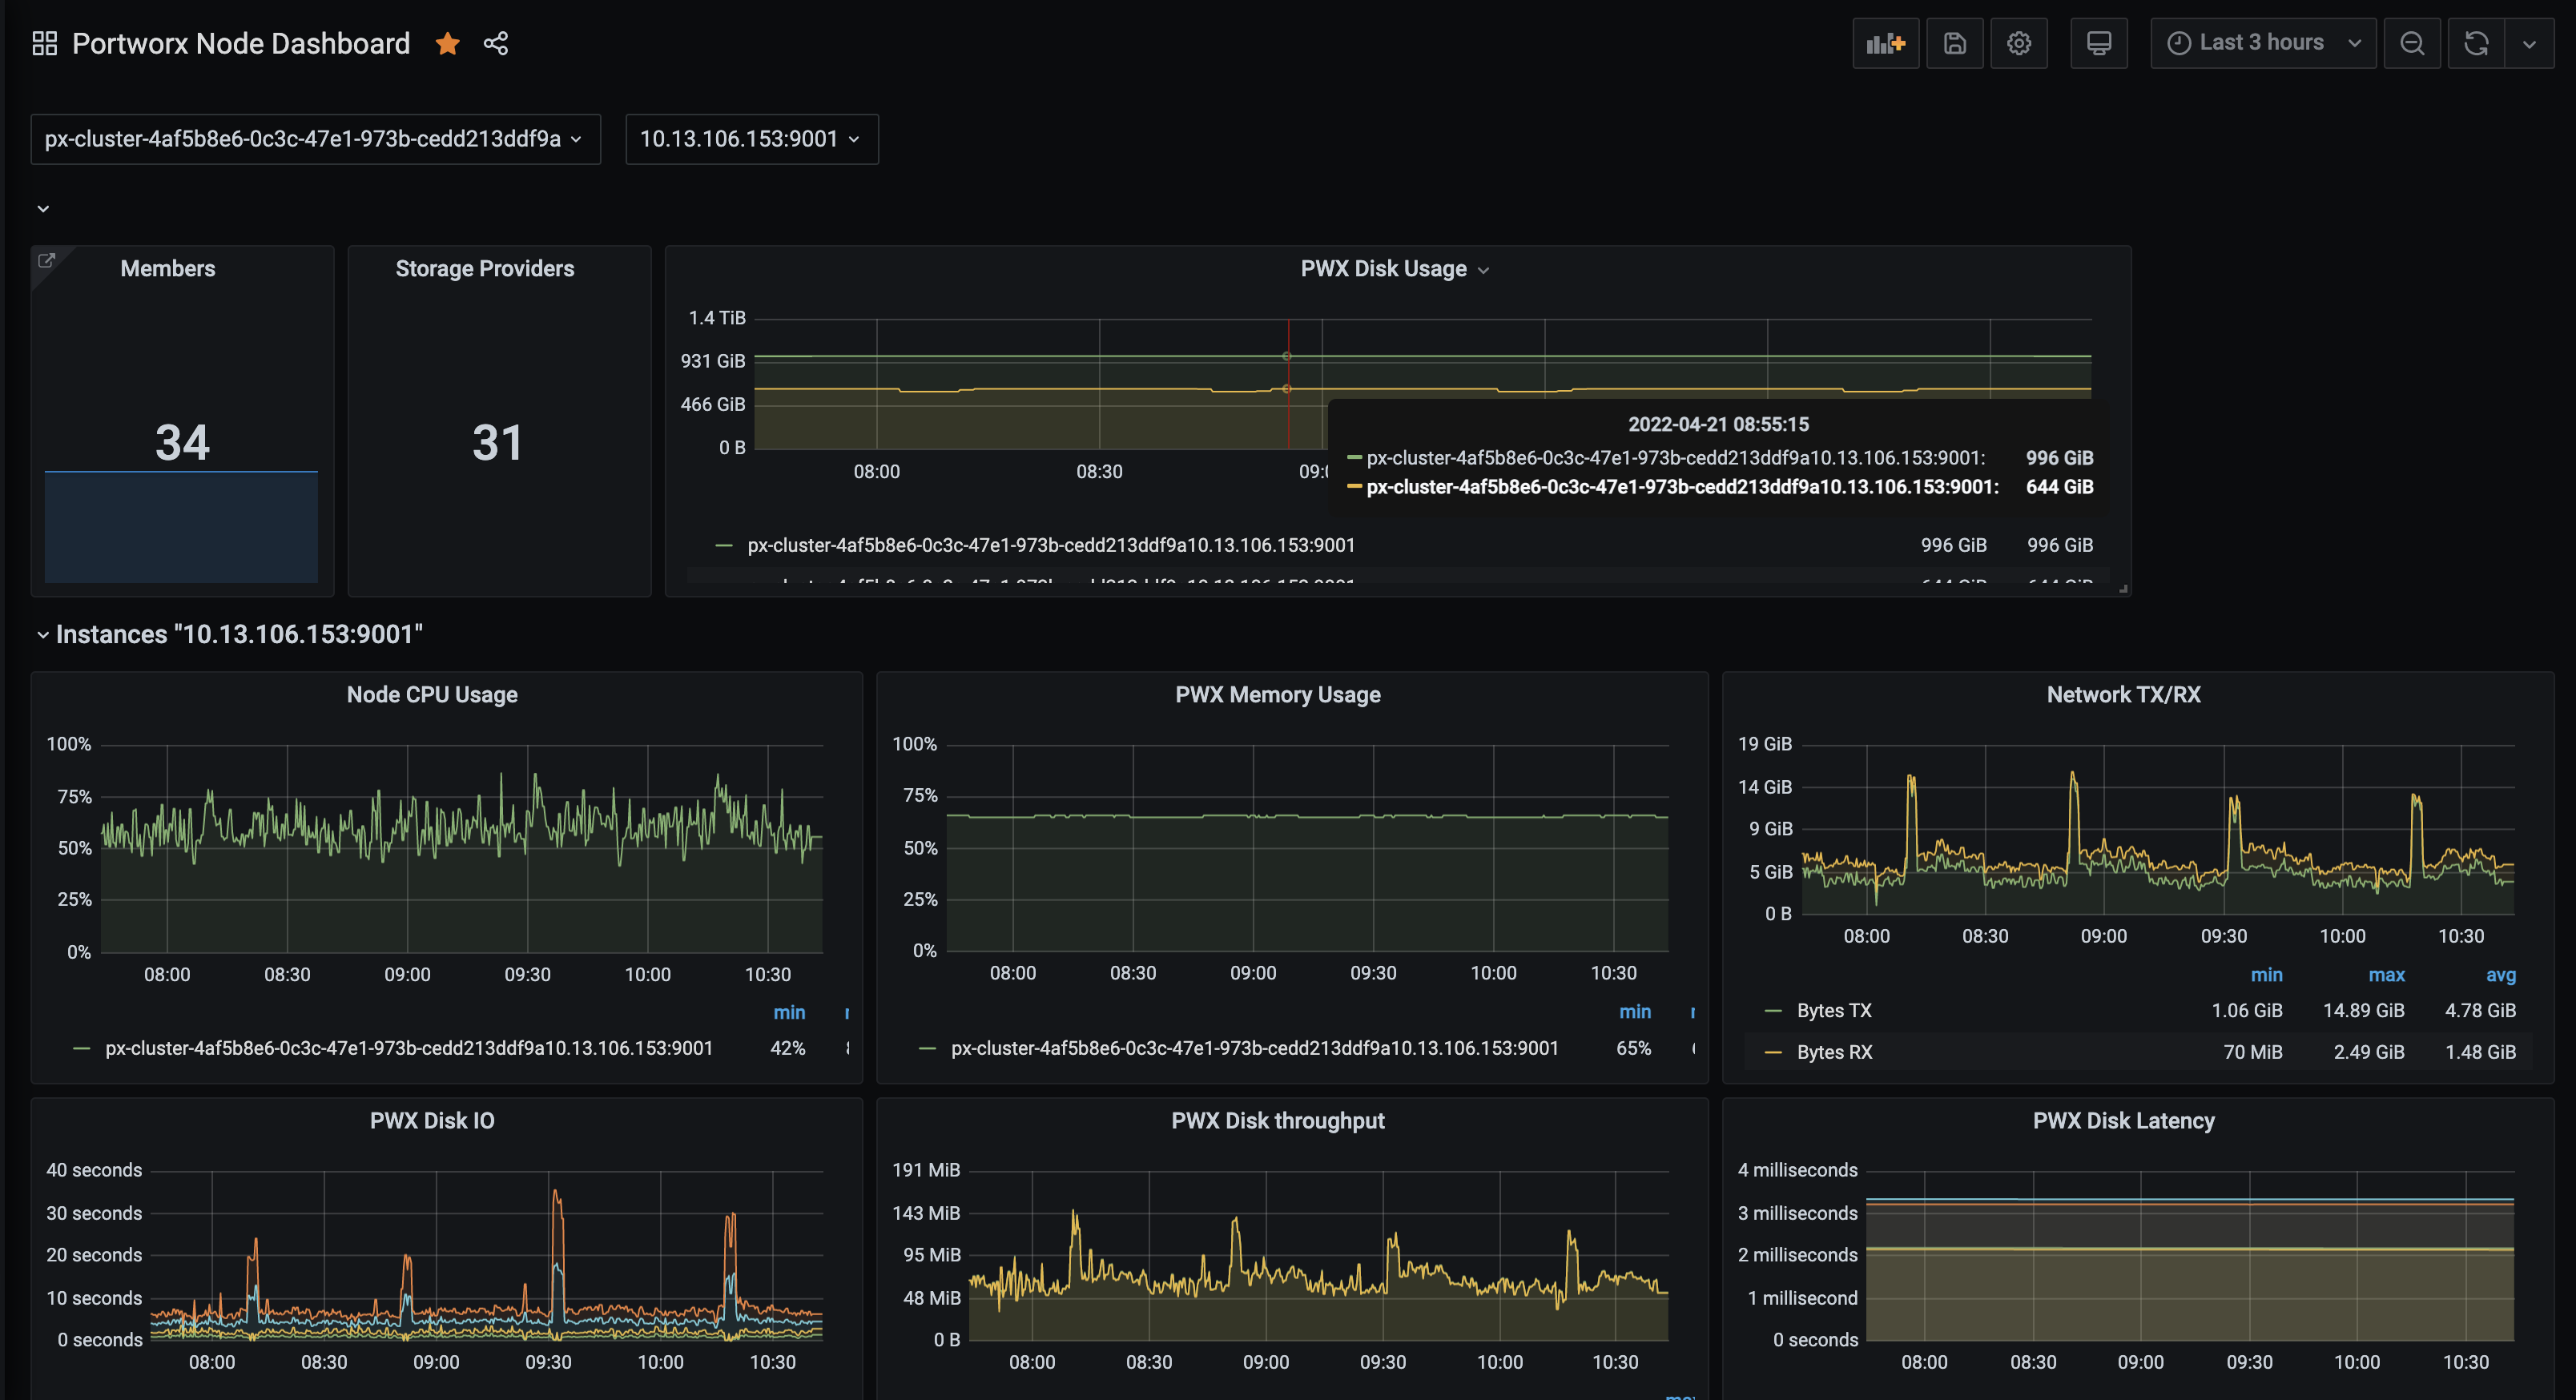
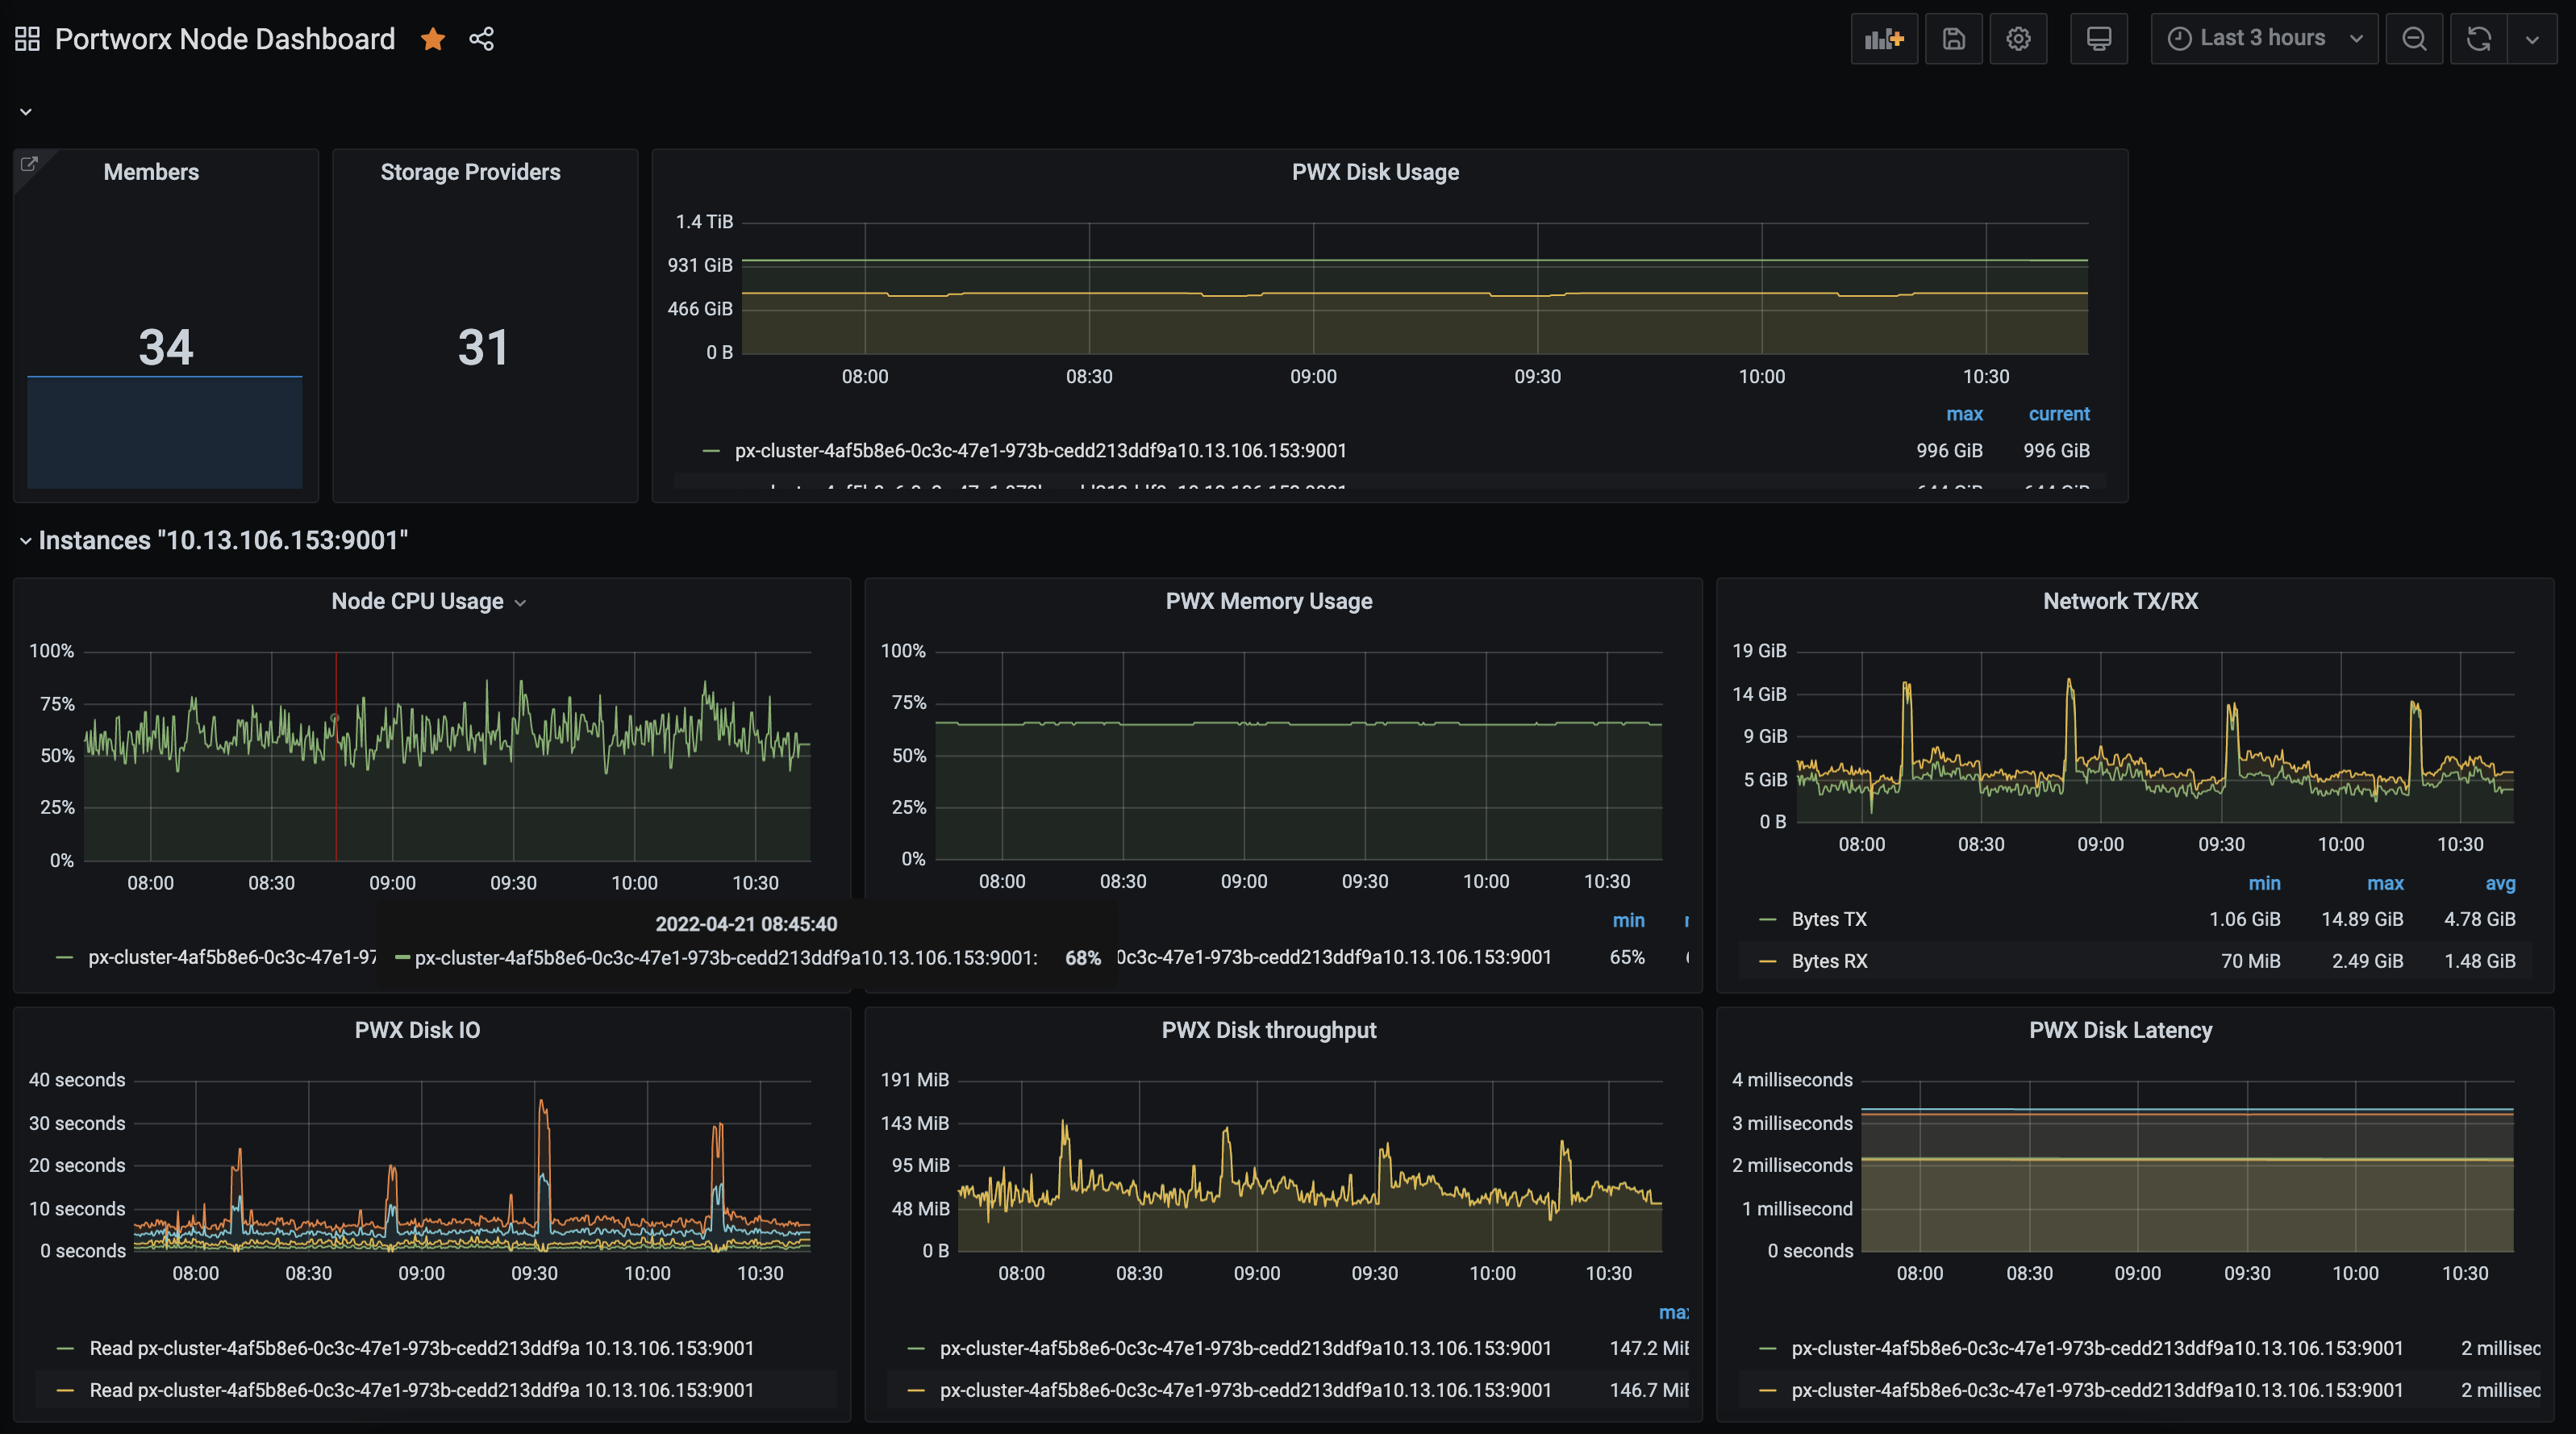
Import the Portworx provided Cluster, Volume, Node, and Performance Grafana templates: From the dropdown on left in your Grafana dashboard, select Dashboards followed by Import, and add the cluster, volume, and node templates.
note- The Performance dashboard should be run only on systems without memory constraints. The dashboard plots a large dataset range, so it's not recommended for systems that have restricted memory.
- Some clusters running with caching enabled might not show any data in I/O Rate.
Once added, you can view your dashboards:
